Dashboard Overview
Four metrics at the top of the dashboard give you a quick overview:
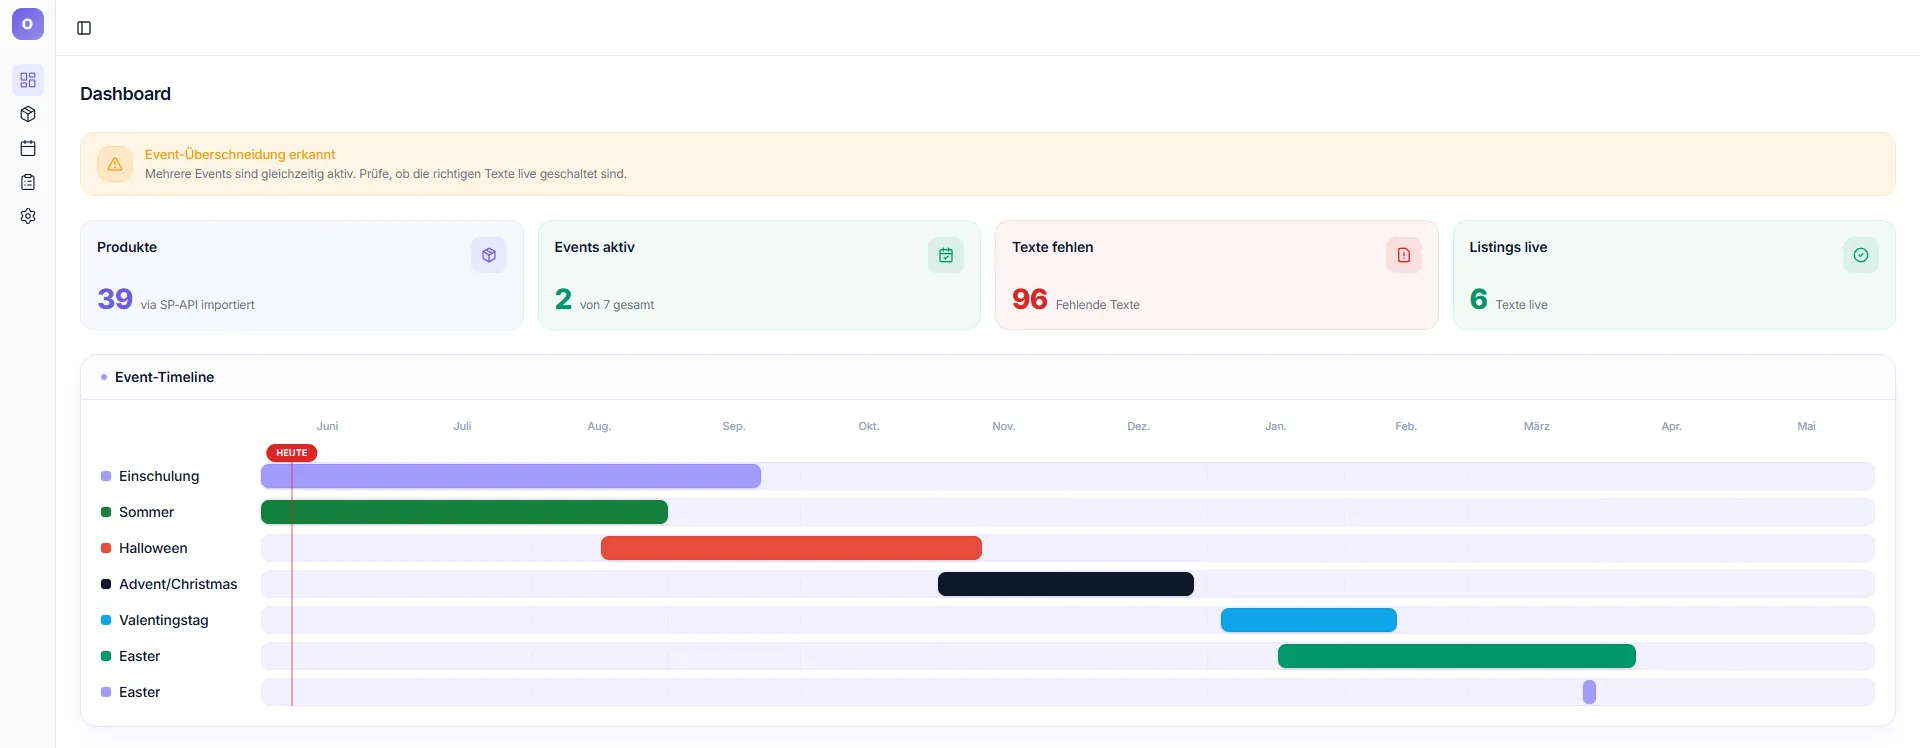
| KPI | Meaning | Click action |
|---|---|---|
| Products | Total number of imported products (via SP-API) | → Inventory (all) |
| Active events | Currently running seasonal events | → Events (active) |
| Texts missing | Products without listing text | → Inventory (filtered: red) |
| Listings live | Texts active on Amazon | → Inventory (filtered: green) |
↑ Click a card to jump directly to the filtered view
Warnings & Banners
Setup checklist "Your first steps"
As long as setup isn't complete, the dashboard shows a checklist card "Your first steps" with a progress bar (X / Y). Each step has its own link:
- Set company name → Settings → Company
- Connect Amazon → Settings → Connections
- Create first event → Events
- Generate AI texts → Inventory (filtered to missing texts)
- Review & edit product texts → Inventory
Steps can be checked off manually; "Hide checklist" closes the card. It disappears automatically once all steps are done.
Event overlap detected
Orange banner when events overlap in time and share products. Notice: "Multiple events are active simultaneously. Check that the correct texts are live."
Event Calendar – Next 12 Months
The Event Calendar at the bottom of the dashboard shows all your events as colored bars on a 12-month timeline. A red vertical line marks "Today".
Recommendations
Below the calendar, the "Recommendations" block lists all events that still have missing texts – active events first. An active event shows a red "Urgent" badge and the note "Event is already active!"; upcoming events show "starts in X days". Per row you see a pill "X text(s) missing" and the "Create texts" button.